

문제는 'StudentsPerformance.csv' 파일을 가지고 진행
# csv 파일 불러오기
df = pd.read_csv('StudentsPerformance.csv')
df
문제1: 데이터 로딩 & 구조 확인하기
# 데이터프레임 (행, 열) 개수 확인
df.shape

# 데이터프레임 정보 : 행/열, 컬럼명, null값 유무(개수), 데이터타입 등
df.info()

# 데이터프레임 상위 5개줄(기본값) 확인
df.head()   # 괄호 안의 숫자 만큼 행을 보여줌
문제2: 결측치 & 중복 점검하기
import pandas as pd

df = pd.read_csv('StudentsPerformance.csv')

# 1) 결측치 개수
print('Missing by column:\n', df.isna().sum())

# 2) 중복 행 개수
dup_cnt = df.duplicated().sum()
print('Number of duplicate rows:', dup_cnt)

# 3) (선택) 중복 제거
df_no_dup = df.drop_duplicates()
print('shape after drop_duplicates:', df_no_dup.shape)
df.drop_duplicates()로 제거한 경우, df.shape로 (행, 열) 을 다시 한 번 확인해보면 좋다.
1번 문제에서 df.shape을 통해 (1000, 8)임을 확인하였으니, 중복행 제거 여부를 확인 가능하다.
해당 데이터에는 중복 행 없음을 확인하였다.
문제3: 단일 히스토그램 - 수학 점수 분포 확인하기
import pandas as pd
import matplotlib.pyplot as plt

# 1) 파일 불러오기
df = pd.read_csv('StudentsPerformance.csv')

# 히스토그램 생성 : ⭐️ 히스토그램은 y값은 분포도(counts)로 정해져있다.
plt.hist(df["math score"], bins=20)
plt.xlabel("Math Score")
plt.ylabel("Counts")
plt.title("Histogram - Mathe Score")
plt.tight_layout()
plt.show()
문제4: 세 과목 모두 80점 이상 -> 성별 분포 단일 막대그래프 나타내기
import pandas as pd
import matplotlib.pyplot as plt

# 1) 파일 불러오기
df = pd.read_csv('StudentsPerformance.csv')

# 2) 세 과목 모두 80점 이상인 학생만 필터
mask = (df['math score'] >= 80) & (df['reading score'] >= 80) & (df['writing score'] >= 80)
high = df.loc[mask]     # 💡⭐️ .loc[조건절]을 하여 데이터프레임 형태로 다시 만듦

# 3) 성별 분포 집계
gender_counts = high['gender'].value_counts()
print(gender_counts)  # ➡️ 시리즈로 반환됨.

# 4) --- Bar Plot (단일 그래프) ---
plt.figure(figsize=(5,4))       # 📌 그래프 영역 크기 설정
plt.bar(gender_counts.index, gender_counts.values)     # 🔥🔥x=Series.index, y=Series.values 로 가져온다!!!
plt.title('High Achievers (>=80 in all) by Gender')
plt.xlabel('gender')
plt.ylabel('count')
plt.tight_layout()     # 그래프를 조금 더 예쁘게!?
plt.show()
주석 4) 에서 나는 아래와 같이 작성하였다.
# 다중 조건 설정 및 불리언 값 -> 데이터프레임화
count = df[(df['math score'] >= 80) & (df['reading score'] >= 80) & (df['writing score'] >= 80)]

# 데이터프레임 확인 : 세 과목 모두 80점 이상인 학생들의 데이터프레임
count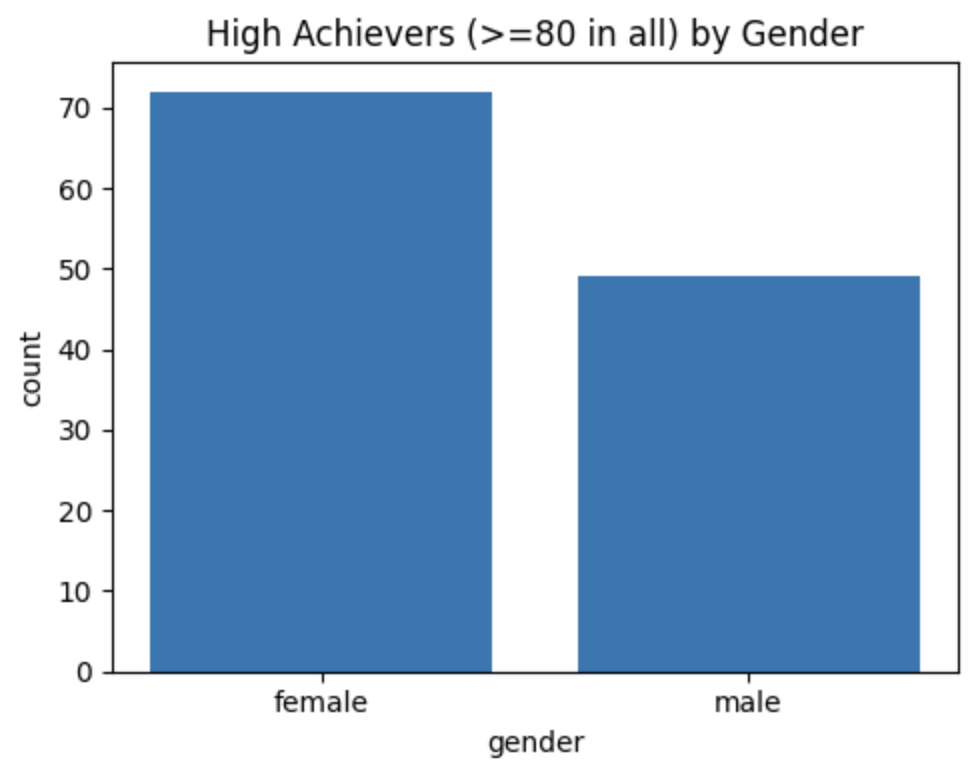
✅ 알게된 점
1. 조건을 주어 필터링을 한 후, 다시 데이터프레임화를 해주는 것이 좋다!!
2. Series 형태로 나온 결과를 Series.index | Series.values 의 형태로 x, y값을 가져올 수 있다.
3. df.loc[행 인덱싱 값, 열 인덱싱 값] 으로 위에서 사용되었다.
문제5: 시험 준비 완료 & 일반 점심의 평균 점수를 막대그래프로 나타내기
import pandas as pd
import matplotlib.pyplot as plt

# 1) 파일 불러오기
df = pd.read_csv('StudentsPerformance.csv')

# 2) 조건을 필터링 하고, 데이터프레임으로 만들고 다시 변수에 저장
mask = (df['test preparation course'] == 'completed') & (df['lunch'] == 'standard')
subset = df.loc[mask, ['math score', 'reading score', 'writing score']]

# 3) 저장된 변수(해당 과목들의 데이터프레임)의 평균를 means 변수에 저장
means = subset.mean().round(1)
print(means)

# 4) plot 막대그래프 생성 : ✅ means.plot 을 변수로 저장해서 하는 방법
ax = means.plot(kind='bar')
ax.set_title("Avg scores (prep=completed & lunch=standard)")
ax.set_ylabel("Score")
plt.ylim(0, 100)
plt.tight_layout()
plt.show()
📌 중요한 점 : 조건으로 필터링 하고, 평균을 내고 등등 후에 변수에 저장하는 것은 정말 중요한 것 같다. 나는 이 부분이 조금 어렵게 느껴진다.
나는 주석 2) - 4)를 아래와 같이 작성하였다.
# 2) 다중 조건 필터링, 데이터프레임화
cond = (df['test preparation course'] == 'completed') & (df['lunch'] == 'standard')
cond = df[cond]

# 3) 필터링 된 데이터에서 세 과목 점수의 평균값 구하기 (소수점 첫째자리)
score_means = cond[['math score', 'reading score', 'writing score']].mean().round(1)
score_means

# 4) 막대그래프 plot : ✅ 변수에 저장하지 않고 바로 진행하는 방법
# plt.figure(figsize=(5,4))
plt.bar(means.index, means.values)     # score_means.plot(kind='bar')도 가능, 이때는 xlabel 생략가능
plt.title('Avg scores (prep=completed & lunch=standard)')
plt.xlabel('Subject')
plt.ylabel('Score')
plt.ylim(0, 100)
plt.tight_layout()
plt.show()
튜터님과 내가 작성한 2), 3), 4)의 코드에서 차이점은.... "변수에 저장하여 DataFrame을 만들었느냐, 아니냐"의 차이 이다.
😂 궁금한 점 : 튜터님의 코드 4)에서 Series.plot()을 ax라는 변수에 저장한 후 이어지는 내용에서 왜 ax.set_title("...") 처럼 작성하는지?? 규칙이겠지.
문제6: 부모 학력별 수학 평균 단일 산점도로 나타내기
import pandas as pd
import matplotlib.pyplot as plt

# 1) 파일 불러오기
df = pd.read_csv('StudentsPerformance.csv')

# 2) 부모 학력별 [수학점수.평균.내림차순]을 변수(avg_math)에 저장
avg_math = (df.groupby('parental level of education')['math score']
              .mean().round(1).sort_values(ascending=False))

# 3) 평균점수를 각각 x, y 변수에 index, values로 저장(단, 인덱스는 .tolist()하여 리스트 형태로 변환!!
x = avg_math.index.tolist()
y = avg_math.values

# 4) Scatter(산점도)
plt.figure()
plt.scatter(x, y)  # 카테고리 축에 직접 산점도
plt.title('Mean Math Score by Parental Education (Scatter)')
plt.xlabel('Parental Education')
plt.ylabel('Mean Math Score')
plt.xticks(rotation=30, ha='right')
plt.ylim(0, 100)
plt.tight_layout()
plt.show()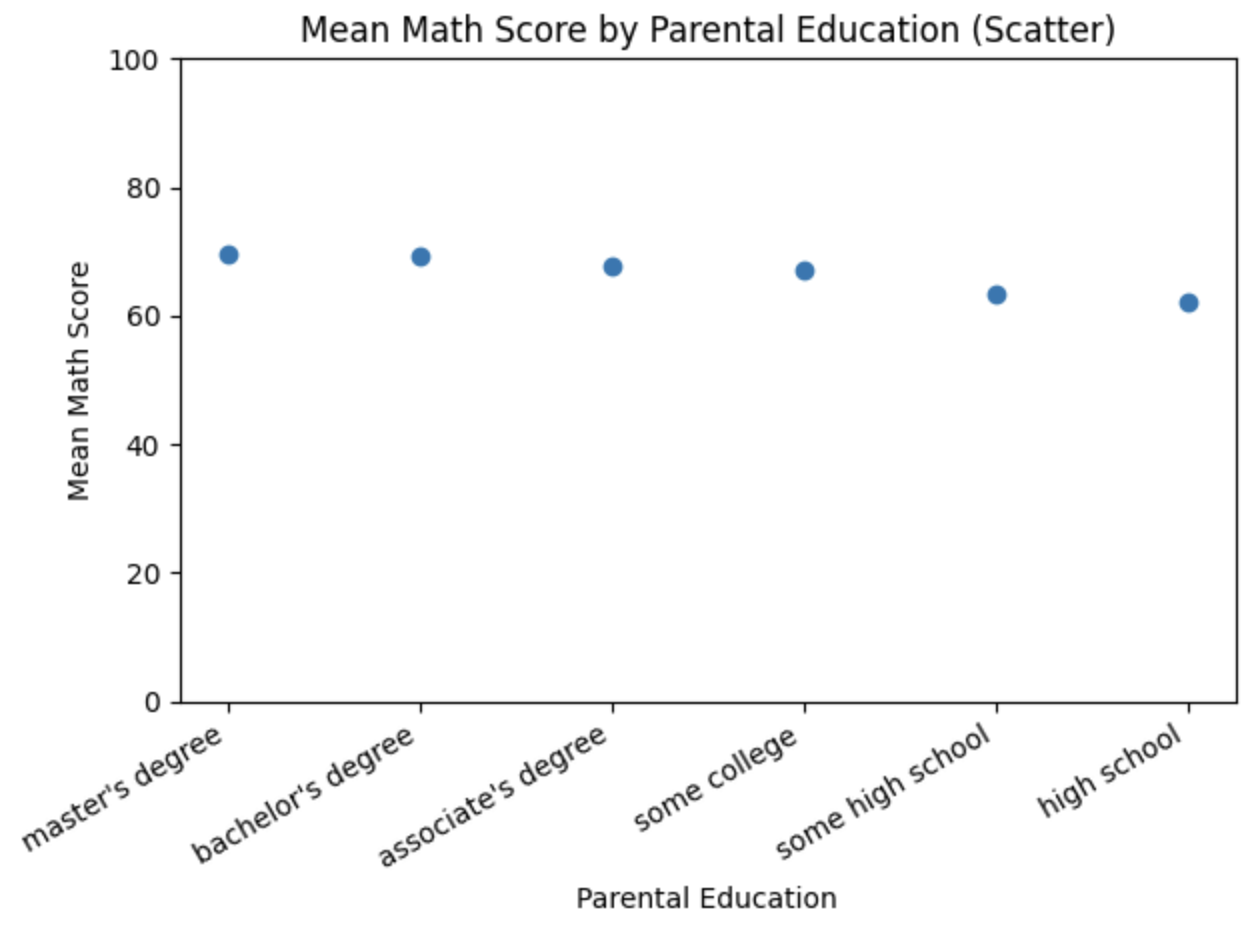
문제7: 부모 학력별 고득점 비율(%) 계산 & 단일 막대그래프로 나타내기
import pandas as pd
import matplotlib.pyplot as plt

# 1) 파일 불러오기
df = pd.read_csv("StudentsPerformance.csv")

# 다중 조건 필터링 : 3과목 모두 80점 이상, 시리즈 -> 데이터프레임화
high_score = df[(df['math score'] >= 80) &
                (df['reading score'] >= 80) &
                (df['writing score'] >= 80)]

# 3과목 모두 80점 이상인 학생의 부모 학업수준별 갯수(?)
high_group = high_score.groupby('parental level of education').size()
print(high_group)

# 전체 학생의 부모 학업수준별 갯수(?)
total_group = df.groupby('parental level of education').size()
print(total_group)

# 비율 = (고득점자 그룹/ 전체그룹)*100
rate = (high_group / total_group) *100

# 내림차순, 소숫점 1번째, 다시 rate을 변수로 할당
rate = rate.sort_values(ascending=False).round(1)
print(rate)

# plot 바 그래프 생성
plt.bar(rate.index, rate.values, width=0.5)
plt.xlabel("parental level of education")
plt.ylabel("percentage (%)")
plt.title("High Achiever Rate (>=80 in all) by Parental Education[%]")
plt.tight_layout()
plt.ylim(0, 100)
plt.xticks(rotation=30)
plt.show()
문제8: 인종/민족 그룹별 읽기 점수 분포 비교(바이올린 플롯)
import pandas as pd
import matplotlib.pyplot as plt
import seaborn as sns

# 1) 데이터 로드
df = pd.read_csv('StudentsPerformance.csv')

# 2) 그룹별 중앙값 계산 (소수점 1자리) + 내림차순 정렬
med = (df.groupby('race/ethnicity')['reading score']
         .median()
         .round(1)
         .sort_values(ascending=False))

print('[Median reading score by race/ethnicity]')
print(med)

# 중앙값이 가장 높은 그룹명 출력
top_group = med.index[0]
top_value = med.iloc[0]
print(f'Top group by median reading score: {top_group} ({top_value})')

# 3) 정렬 순서 적용한 단일 바이올린 플롯
order = med.index.tolist()

plt.figure()
sns.violinplot(
    data=df,
    x='race/ethnicity',
    y='reading score',
    order=order,     # ✅ [order=변수] : 변수의 순서로 그래프를 정렬한다???
    inner='quartile'  # 중앙값/사분위선 표시
)
plt.title('Reading Score Distribution by Race/Ethnicity (Violin, ordered by median)')
plt.xlabel('race/ethnicity')
plt.ylabel('reading score')
plt.ylim(0, 150)      # 점수 범위 권장
plt.xticks(rotation=15)
plt.tight_layout()
plt.show()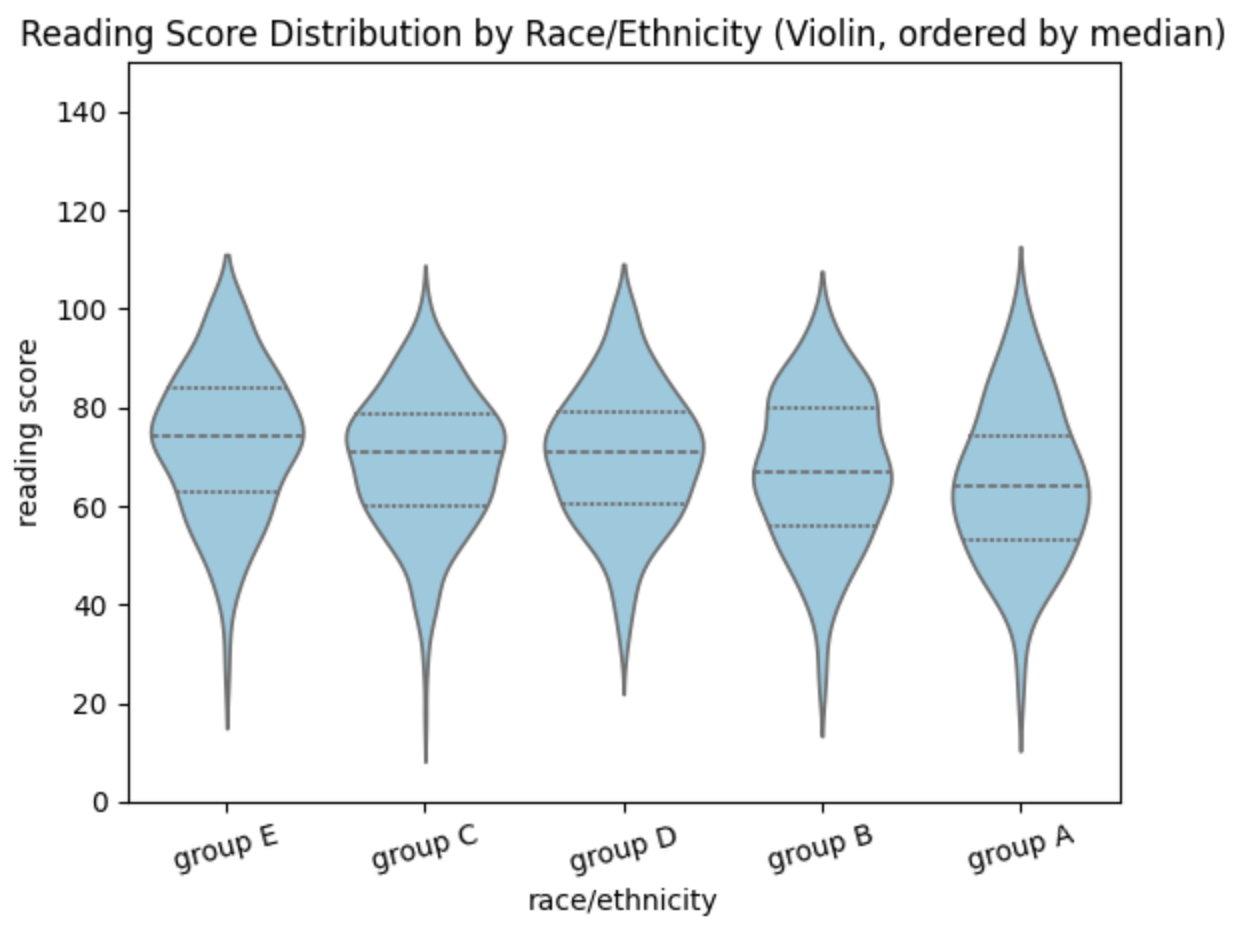
💡 개인과제 후 회고
전처리&시각화 개인과제를 마친 후 나의 약점을 제대로 확인할 수 있었다. 우선 전처리 과정에서 .iloc() 와 .loc 를 다시 짚고 넘어가야겠다는 생각을 했고, 코드를 작성하는 과정에서 '변수에 저장' 하는 것이 코드를 조금이나마 단순화 시키고 더 나은 작성법이라는 것을 깨닫게 되었다.
'데이터 전처리 & 시각화' 카테고리의 다른 글
| 그래프 시각화 한글 인코딩 문제 해결 코드 (0) | 2025.09.08 |
|---|---|
| [전처리/시각화] 개인과제 문제7번 : 부모 학력 수준별 고득점 비율(%) 계산 & 단일 막대 그래프로 나타내기 (0) | 2025.09.02 |
| [데이터 전처리 ] 중복 제거 (2) | 2025.08.28 |